Published on: November 20, 2024
6 min read
Data-driven DevSecOps: Exploring GitLab Insights Dashboards
Learn how to leverage GitLab Insights Dashboards to visualize key metrics, track project progress, and boost team productivity with customizable, data-driven views.


Metrics and analytics play a crucial role in driving productivity, quality, and success. GitLab, as a comprehensive DevSecOps platform, offers powerful tools for tracking and visualizing these vital metrics through its Insights Dashboards. In this article, you'll learn how to use the Insights Dashboards in your environment.
Introduction to GitLab metrics and analytics
GitLab provides an array of metrics and analytics tools that cover various aspects of the DevSecOps lifecycle:
- Productivity Analytics: Track team velocity, cycle time, and lead time.
- Code Review Analytics: Measure code quality, test coverage, and review efficiency.
- CI/CD Analytics: Monitor pipeline performance and deployment frequency.
- Value Stream Analytics: Visualize the flow of work from idea to production.
- Insights: Explore and visualize data about your projects and groups.
These metrics offer invaluable insights into your development process, helping teams identify bottlenecks, optimize workflows, and make data-driven decisions.
Leveraging labels for specific metrics
One of GitLab's most powerful, yet understated features, is Labels, which allows you to filter and focus on specific metrics with pinpoint accuracy. By strategically applying labels to issues, merge requests, and epics, you can create custom views that provide targeted insights into your project's performance and progress.
Labels in GitLab act as versatile identifiers, allowing you to categorize and organize your work items with great flexibility. Whether you're tracking feature development, bug fixes, or team-specific tasks, labels enable you to slice and dice your project data in ways that reveal meaningful patterns and trends. This concept parallels the use of tags in cloud deployments, where resources are labeled for easier management, cost allocation, and operational insights.
By thoughtfully labeling your work items, you're essentially creating a sophisticated labeling system that can be leveraged to generate custom dashboards and reports. This approach empowers you to zoom in on the metrics that matter most to your team or stakeholders, providing a clear and focused view of your project's health and momentum.
How to configure GitLab Insights
GitLab Insights allow you to explore and visualize data about your projects and groups. They provide valuable analytics on various aspects such as issues created and closed during a specified period, average time for merge requests to be merged, and triage hygiene. Insights can be configured for both projects and groups.
To configure Insights:
- For project insights:
- Create a file named
.gitlab/insights.ymlin the root directory of your project.
- Create a file named
- For group insights:
- Create a
.gitlab/insights.ymlfile in a project that belongs to your group. - Go to your group's Settings > General.
- Expand the Analytics section and find the Insights section.
- Select the project containing the configuration file and save changes.
- Create a
The .gitlab/insights.yml file is a YAML file where you define the structure and order of charts in a report, as well as the style of charts to be displayed. Each chart definition includes parameters such as title, description, type, and query to specify the data source and filtering conditions.
To view insights, navigate to Analyze > Insights in your project or group.
Customize merge request insights
While the default view provides valuable raw information, we can customize the Insights Dashboard to uncover additional layers of information, such as which team was responsible for each merge request and what type of problem each one solved.
Merge request insights for each squad and requirement type
Measuring squad productivity in GitLab can be challenging, especially when the GitLab group and subgroup structure doesn't align perfectly with your squad organization. Here's how to overcome these challenges and effectively track squad productivity:
Setting up squad-based metrics
- Label creation: Create unique scope labels for each squad (e.g.,
squad::alpha,squad::beta) and each requirement type (e.g.,type::bug,type::feature,type::maintenance).
- Label application: Consistently apply these squad labels to all issues and merge requests handled by each squad, regardless of the project or group they're in.
Hints:
- Use GitLab API to apply labels massively to existing open, merged, and closed MRs.
- Add/remove/update labels as part of your GitLab CI pipeline.
- Leverage the GitLab Triage Bot to automate the labeling process.
- Dashboard setup: Create a
.gitlab/insights.ymlfile in your project repository with custom charts for team-specific and type-specific merge request insights.
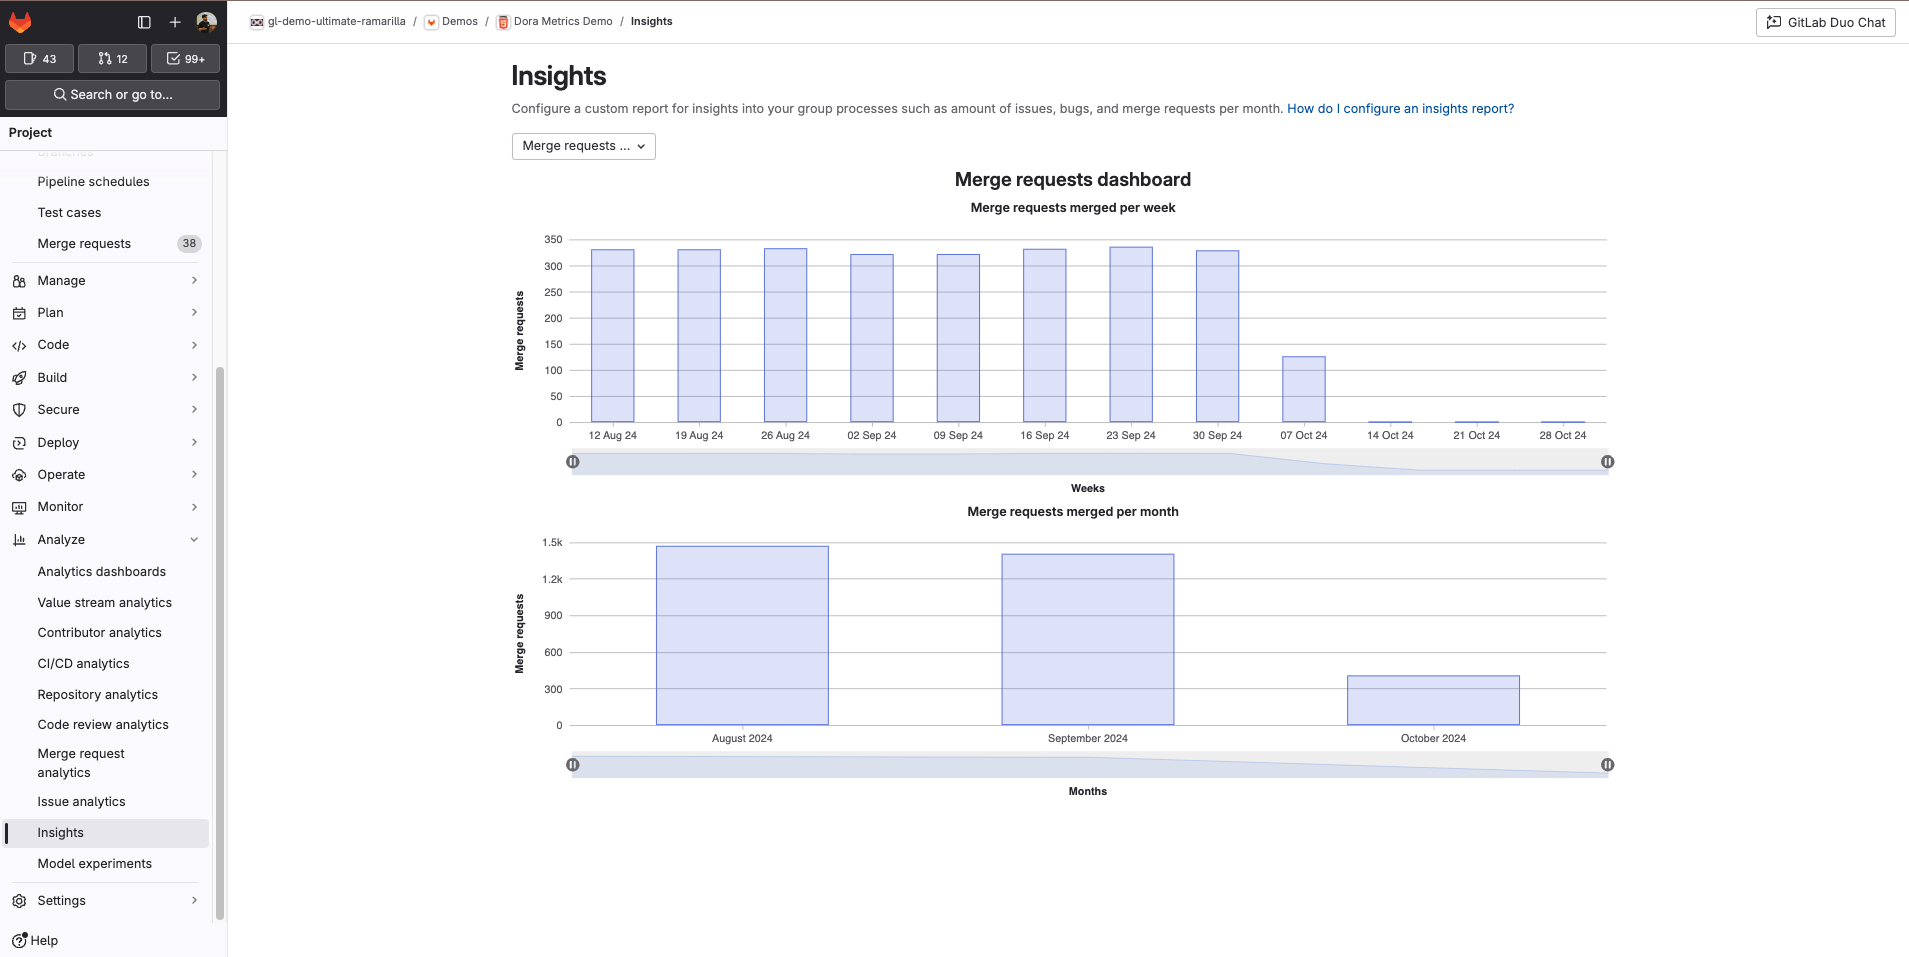
## Default Merge Requests insights.yml
mergeRequests:
title: Merge requests dashboard
charts:
- title: Merge requests merged per week
type: bar
query:
data_source: issuables
params:
issuable_type: merge_request
issuable_state: merged
group_by: week
period_limit: 12
- title: Merge requests merged per month
type: bar
query:
data_source: issuables
params:
issuable_type: merge_request
issuable_state: merged
group_by: month
period_limit: 3
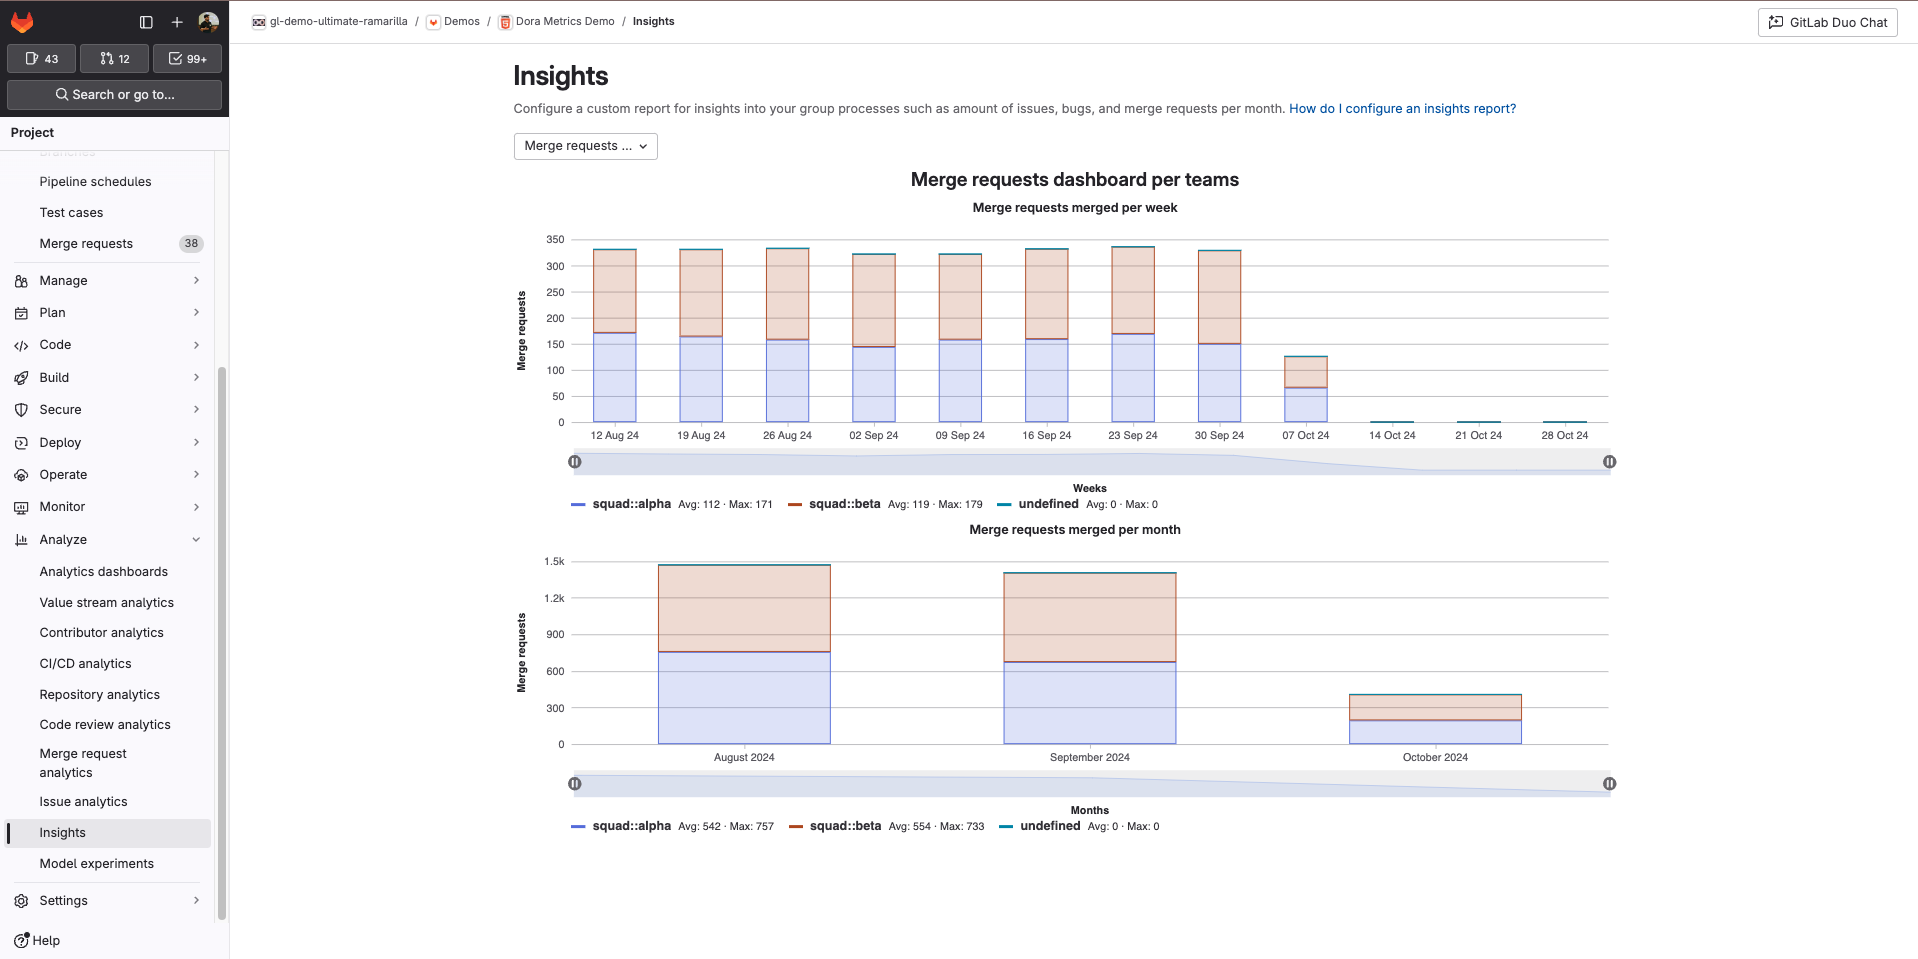
## Per-teams Merge Requests insights.yml
mergeRequestsTeams:
title: Merge requests dashboard per teams
charts:
- title: Merge requests merged per week
type: stacked-bar
query:
data_source: issuables
params:
issuable_type: merge_request
issuable_state: merged
group_by: week
period_limit: 12
collection_labels:
- squad::alpha
- squad::beta
- title: Merge requests merged per month
type: stacked-bar
query:
data_source: issuables
params:
issuable_type: merge_request
issuable_state: merged
group_by: month
period_limit: 3
collection_labels:
- squad::alpha
- squad::beta
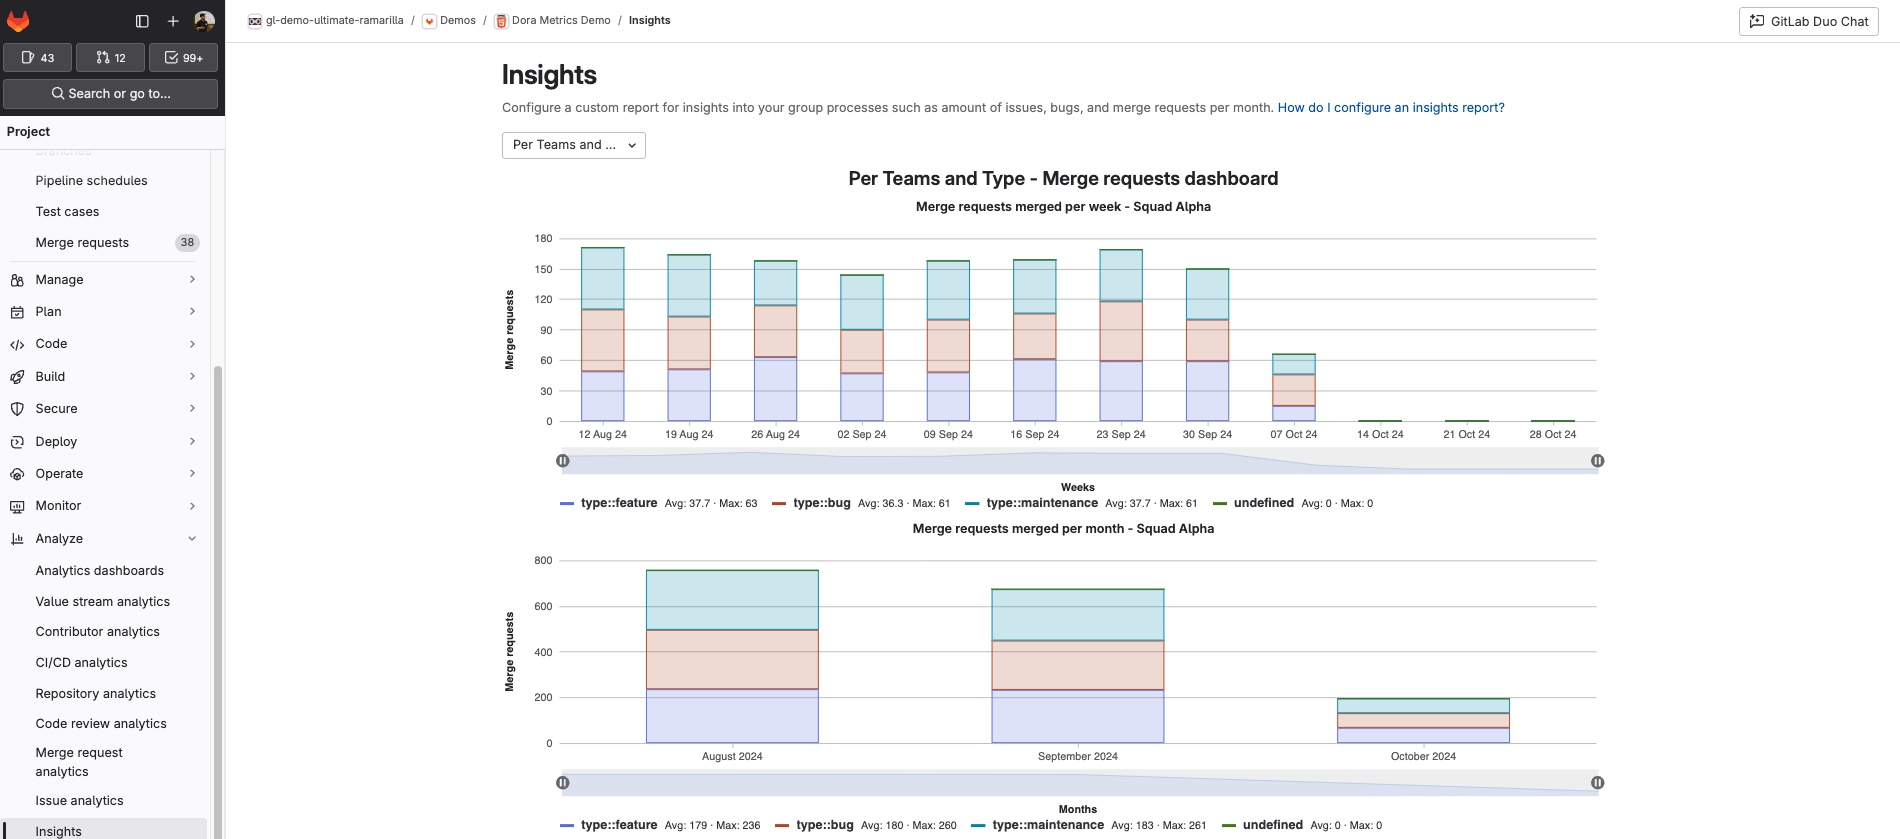
## Per-teams and Type Merge Requests insights.yml
mergeRequestsTeamsAndType:
title: Per Teams and Type - Merge requests dashboard
charts:
- title: Merge requests merged per week - Squad Alpha
type: stacked-bar
query:
data_source: issuables
params:
issuable_type: merge_request
issuable_state: merged
filter_labels: squad::alpha
collection_labels:
- type::feature
- type::bug
- type::maintenance
group_by: week
period_limit: 12
- title: Merge requests merged per month - Squad Alpha
type: stacked-bar
query:
data_source: issuables
params:
issuable_type: merge_request
issuable_state: merged
filter_labels: squad::alpha
collection_labels:
- type::feature
- type::bug
- type::maintenance
group_by: month
period_limit: 3
- title: Merge requests merged per week - Squad Beta
type: stacked-bar
query:
data_source: issuables
params:
issuable_type: merge_request
issuable_state: merged
filter_labels: squad::beta
collection_labels:
- type::feature
- type::bug
- type::maintenance
group_by: week
period_limit: 12
- title: Merge requests merged per month - Squad Beta
type: stacked-bar
query:
data_source: issuables
params:
issuable_type: merge_request
issuable_state: merged
filter_labels: squad::beta
collection_labels:
- type::feature
- type::bug
- type::maintenance
group_by: month
period_limit: 3
By implementing these customizations, you can create insightful dashboards that provide a clear view of merge request activity per team and requirement type, allowing you to visualize trends over time, compare performance between squads, and analyze the distribution of different types of work for each squad.
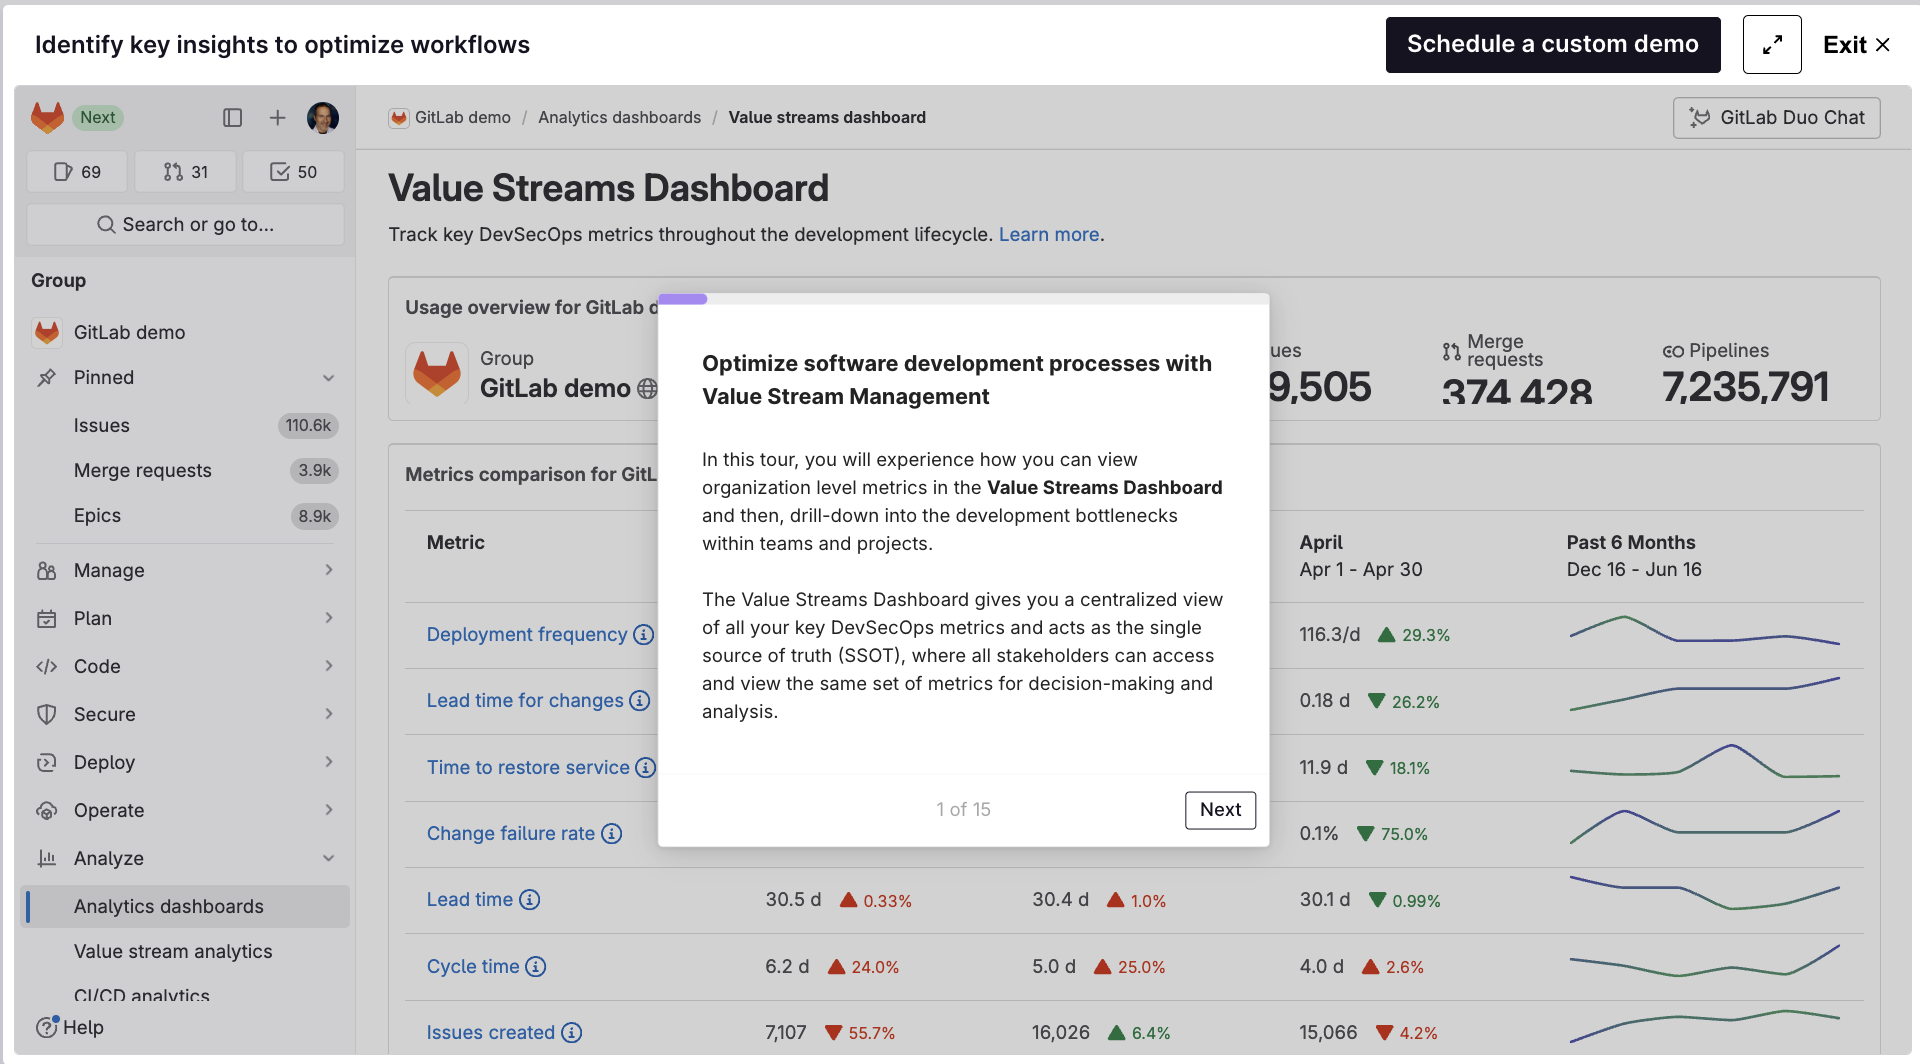
Get started today
GitLab Insights is just the tip of the iceberg when it comes to metrics and analytics. To explore the full range of GitLab's powerful analytics features, including Value Stream Analytics, CI/CD Analytics, and Code Review metrics, check out our Value Stream Management product tour:
Ready to start your own metrics journey? Sign up for a free 60-day trial of GitLab Ultimate today and unlock the full potential of data-driven DevSecOps.